Multispectral Analysis of Plant Physiological Stress.
A two-stream CNN that reads crop stress from imagery — predicting leaf temperature to ~2.1 °C MAE, running live in your browser.
Try it — a neural network running in your browser.
Runs entirely in your browser via TensorFlow.js — no server, no upload; your image never leaves your device.
This live demo runs a lightweight, single-frame, RGB-only version of the model (EfficientNetV2). The full research model additionally fuses multispectral indices (NDVI, NDRE) through a two-stream FiLM architecture. Predictions here are raw and illustrative, not agronomic-grade.
Stress hits yield long before it's visible.
Drought and heat depress oat and barley yields well before any visible symptom appears. The gold-standard readings — leaf temperature (Tleaf) and stomatal conductance (gsw) — come from a handheld LI-600 porometer: one leaf, one number, one operator.
That doesn't scale. This project asks whether the same physiological signal can be recovered non-invasively from imagery a gantry can capture at plot scale, every day, without touching a plant.
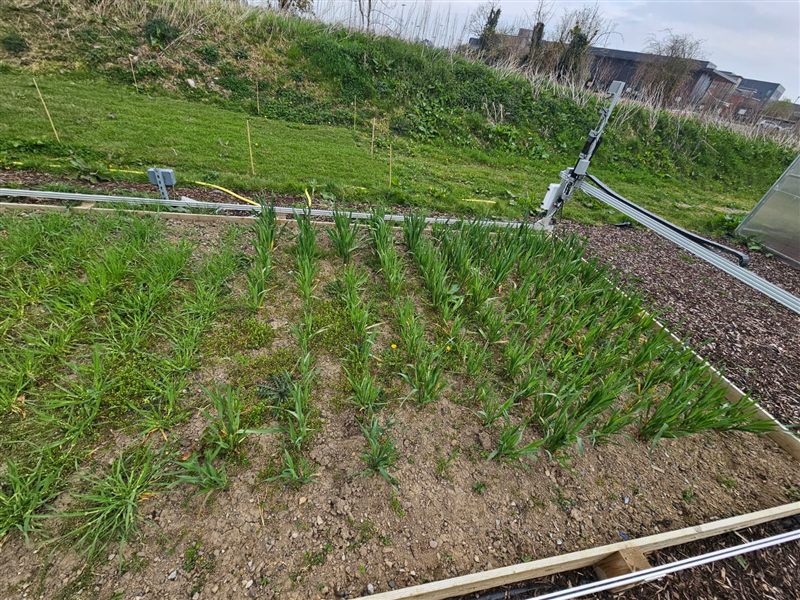
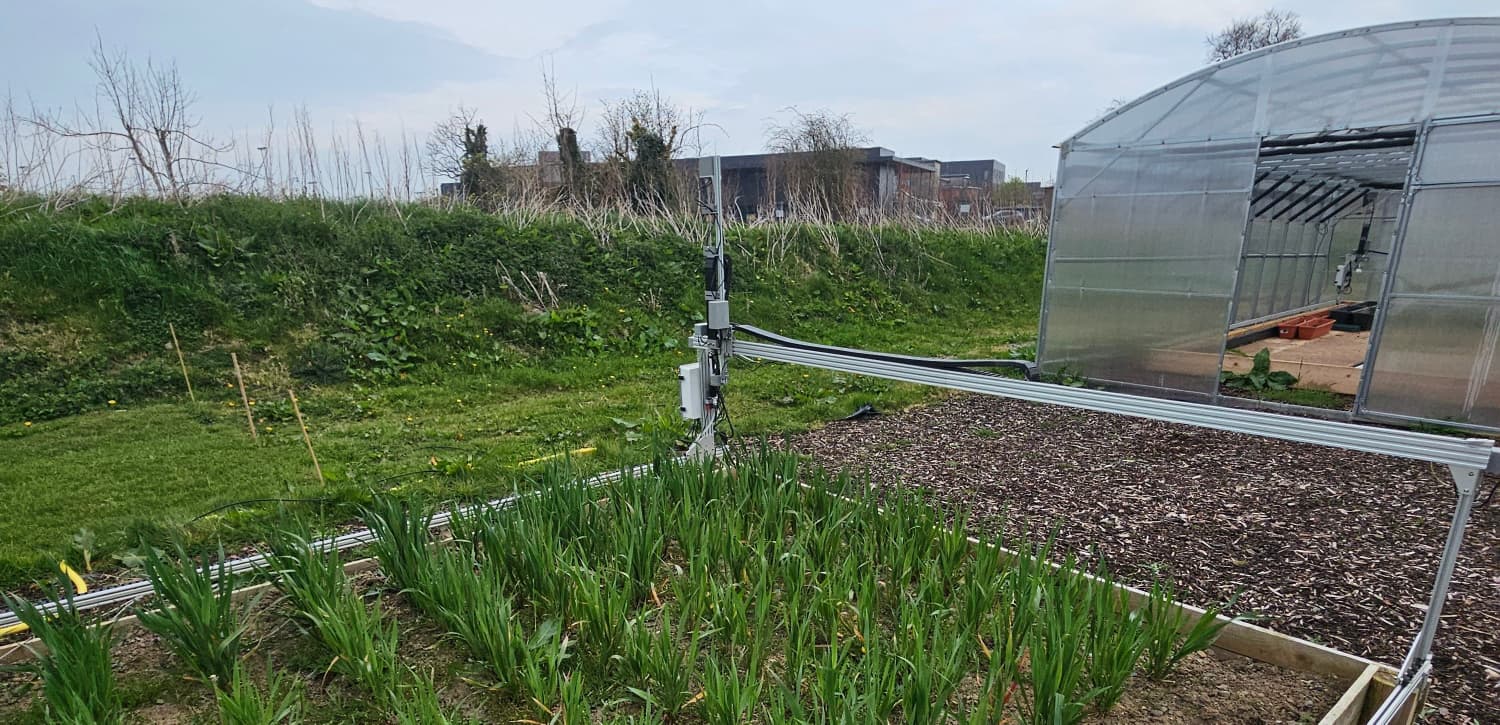
Controlled farmbed → multispectral capture → two-stream fusion.
Gantry-mounted multispectral rig records RGB, NIR, and red-edge MKV video across oat and barley plots under scheduled drought/heat treatments.
Per-plant LI-600 Licor readings — Tleaf and gsw — are logged with precise timestamps and paired to the nearest video frame.
Automated frame extraction; per-pixel NDVI and NDRE; NDVI > 0.15 foreground mask to drop soil and background before the network sees the frame.
- RGB
- EfficientNetV2 preprocess baked into the graph
- NIR / red-edge
- z-scored to ±3σ per channel
- Indices
- NDVI, NDRE computed per pixel
- Mask
- NDVI > 0.15 → foreground vegetation only
- TTA
- horizontal flip averaged at inference
- Loss
- Huber (regression, robust to outliers)
- Optimizer
- AdamW with cosine-decay LR
- Schedule
- backbone warm-up → partial unfreeze
- Regularization
- EarlyStopping + best-checkpoint restore
- Split
- 80 / 20 train / validation
Two-stream network, FiLM-fused
Two-stream architecture — an EfficientNetV2-B3 RGB encoder and a spectral-indices CNN fused via FiLM gating. The in-browser demo runs a separate distilled RGB-only model.
Project-specific stress thresholds
| Severity | Level | Range (gsw · mol·m⁻²·s⁻¹) |
|---|---|---|
| Severe | gsw < 0.05 | |
| High | 0.05 ≤ gsw < 0.1 | |
| Medium | 0.1 ≤ gsw < 0.2 | |
| Low | 0.2 ≤ gsw ≤ 0.3 | |
| Normal | gsw > 0.3 |
| Severity | Level | Range (Tleaf · °C) |
|---|---|---|
| Normal | Tleaf < 25 | |
| Low | 25 ≤ Tleaf < 28 | |
| Medium | 28 ≤ Tleaf < 30 | |
| High | 30 ≤ Tleaf < 35 | |
| Severe | Tleaf ≥ 35 |
Interpretive thresholds specific to this project — not universal agronomic standards.
Heat-stress classification (test set)
Read this one honestly: the classifier predicted Normal for every leaf, catching 0 of 6 Low-stress cases. Its ~90% accuracy is the class balance talking (52 of 58 leaves are Normal), not sensitivity — macro-F1 is 0.47. On this small, imbalanced set the thresholded classifier adds nothing over predicting the majority class; the 2.1 °C regression MAE above is the meaningful result. The stomatal-conductance (gsw) classifier remains under active development and is intentionally not reported here.
What worked, what didn't
| MAE | ≈ 2.1 °C |
| RMSE | ≈ 2.6 °C |
| R² | 0.199 |
| vs. indices-only MLP baseline | 2.1 vs 2.5 °C |
Tleaf is the reliable, physiologically-grounded output — usable as a non-destructive screen for early heat stress on the controlled farmbed. Fusion beats the indices-only baseline; an RGB-only ablation was not run, so that comparison isn't claimed here.
gsw is physiologically volatile and hard to infer from a single static frame — stomata open and close on the order of minutes in response to light, water potential, and VPD.
The dataset is deliberately small (controlled Maynooth farmbed, oats & barley). No gsw accuracy is claimed — presented here for transparency, not as a validated result.
Roadmap: temporal NPZ clip modeling so the network watches stomatal response over time, plus VPD + ambient sensor fusion to remove single-frame leakage.
Capture to prediction
Multispectral MKV recordings across oat & barley farmbeds under controlled drought / heat treatments.
Automated frame extraction, then LI-600 timestamp alignment pairs each frame with ground-truth gsw and Tleaf.
NDVI and NDRE computed per pixel; NDVI > 0.15 masks foreground vegetation and drops soil / background.
Two-stream inference with 3-seed ensembling, horizontal-flip TTA, and Ridge calibration on Tleaf.
Leaf temperature to ~2.1 °C MAE.
The two-stream RGB + spectral fusion model beats the indices-only MLP baseline (2.5 °C MAE). An RGB-only ablation was never run, so that comparison isn't claimed. Stomatal conductance (gsw) is a harder physiological signal from a single static frame and remains an active research target — no published gsw metric is claimed here.
Non-invasive, scalable, water-saving crop monitoring.
A camera on a gantry — no probes, no operator per leaf — that reliably ranks plants by heat stress makes early-warning irrigation and breeding trials tractable at plot scale.
- →Temporal NPZ clip modeling so the network watches stomata respond over time.
- →VPD + ambient sensor fusion — cost-effective, leakage-free inputs alongside imagery.
- →Larger, balanced datasets across more cultivars and stress conditions.
ROS-based robotic assistance and voice-controlled automation for elderly farmers — a simulation-first companion to the plant-stress thesis.
Turning an open-source farming robot's messy CAD export into a clean, simulatable, plannable digital twin — the motion and camera-mounting layer the plant-stress thesis builds on top of.